Our case studies.
Your results, our AI.
Biotech
Building an automated customer journey that shortens the sales cycle, reduces the cost to service with an increased overall sale value.

The client is a constituent of the FTSE 250 index and leading biotech company, with global headquarters, focused on using advanced technologies to support businesses across the world. They use innovative gene-editing technologies to advance agricultural practice and create a more sustainable and efficient global food system.
When the client approached us, their data collection was chaotic. Their approach to sales and revenue generation was labour intensive, and despite having a lot of customer data, they weren’t using it to develop improved customer service or targeted account growth. They had a one size fits all service which meant that their cost of sale was high, they experienced high levels of churn across their customer base and they weren’t considered a trusted partner.
The client had three main objectives for programme:
- Initially the challenge was to collect and convert large amounts of both structured and unstructured data into actionable insights that the business could use to better forecast demand and drive sales.
- These insights would then enable them to segment their customers based on their needs and behaviours, and map all the customer journeys, allowing for increased understanding of touchpoints and friction.
- All this additional information would be fed into the design and implementation of segment specific Go To Market (GTM) strategies that have the ability to automate significant elements of the marketing sales cycle, and therefore focus expensive sales resources on only the most valuable opportunities. Through timely, personalised, and relatable content, they would increase customer engagement and create a more streamlined sales service.
The Challenge:
The client was dealing with messy data collection, stored across different platforms with no single point of truth. This meant that their data couldn’t give them accurate insight into their customer base, or their customer needs. All their sales required a salesperson to facilitate, driving up their cost of sale.
The Solution:
We captured all their data in a single location, aggregating it to give us better insights into the customer journey, their needs, and preferences. That enabled us to build more streamlined service and sales journeys that didn’t rely on 1-2-1 sales. We created personalised, automated journeys that shortened the sales cycle, reduced cost to service, and increased overall sale value.
The Results:
0%
Year on year increase in sales
Part 1: Capturing and structuring data for transformative insights.
We worked with the client to take their complex and disparate data and unlock it’s potential. Their structured data existed in multiple locations and formats, unconnected from one another and unaggregated. This meant there were multiple versions of the truth across their data domains. The first thing we did was to unify and aggregate all these different data sources.
They also had significant amounts of data that remained unstructured and unlinked, even though linking it to other data points would add value. So, we used Natural Language Processing (NLP) to organise and extract meaning from previously unused data.
As a result:
- The integrated data created a complete view of the customer, from their behaviour and motivations to the outcomes achieved (including profitability and satisfaction).
- They could better understand customer behaviour, needs, satisfaction, and financial outcomes.
- They were able to take all these insights and create meaningful customer segments and strategies for those segments that the organisation could align their efforts around.
Part 2: Building differentiated customer journeys that drive revenue
With a better understanding of the different customer segments, we were able to define personas with unique messaging for each and activation tactics that matched their needs and behaviours. We put together customer surveys to gather feedback directly from the company’s current and potential customers. We gathered website and social media analytics to gain a picture of the online presence of the business and the digital journeys customers took.
We developed a customer scoring matrix which enabled us to develop distinct revenue strategies depending on where they fell in the customer journey. At one end of the spectrum, we employed automation to build loyalty through insights and engagement. At the other end we implemented strategic Account Based Marketing (ABM) to target and nurture specific accounts that required a high touch 1-2-1 sales approach. By fully integrating marketing, sales, and customer success, we were able to build multiple bespoke customer journeys based on the most efficient and effective routes for revenue.
Part 3: Blending AI and MarTech for personalisation and automation
Finally, we took all their tech and data solutions and integrated them. We integrated their CRM systems with the segments and data models we had created, which meant all communications could be personalised for:
- Content
- Offer
- Channel
- Timing
- Location
By automating the marketing campaigns, the company were able to scale and improve efficiency as well as improving personalisation, as the campaigns were triggered by customer actions, which would then deliver the most relevant messaging at the most appropriate time.
We built:
- An integrated, automated data collection and analysis process that gave the business a clearer picture of their customer and what they want.
- Multiwave automated campaigns that responded to customer activity, so that messaging would be delivered at the most impactful moments on the customer journey.
- Follow up marketing triggered by customer action so that prospects weren’t ever left to go cold, and customers received personalised messaging.
- Customer segmentation programmes powered by AI that linked customer data collected at earlier stages with relevant content designed following insights gleaned directly from customers.
- Large Language Models (LLMs) that continually learn from customer data to improve targeted messaging, increasing engagement and converting sales more quickly.
Restaurant Chain
Providing the customer a way to capture their data into a single platform dashboard to forecast demand and capacity.
The client is a premium restaurant business with four different brands and 30 restaurants. The brand is predominantly in Northern England with several locations in London and restaurants are situated across diverse settings including the city centre, suburbs and out of town shopping centres.
When the client approached us, they were experiencing significant differences in performance across their sites. Diverse drivers of footfall had led to inconsistent demand day to day, and the disruption caused by the pandemic meant they didn’t have representative historical performance for valuable measurement metrics. Inflation and economic uncertainty had been impacting consumer spending, and all of this was contributing to increased levels of unpredictability in the business.
The client’s objective was to improve the control of operating costs by having a more accurate understanding of future demand. They hoped to use this understanding to adapt their operations and marketing site by site.
The Challenge:
The client had significant performance differences across their sites, but very little visibility of data that would enable them to forecast demand or streamline spend. This meant there was considerable wastage across staffing and marketing.
The Solution:
By capturing their data in a single platform with dashboard to forecast demand and capacity, the company were able to adapt their marketing campaigns, balance their staffing needs with occupancy levels.
We worked with the client to create a dashboard that forecast demand and capacity for every restaurant at any point of the day. Users could review this data at any level they choose.
The Results:
- The marketing team were able to adapt campaign, activity, and individual site promotions to drive demand in the places it was most required. This reduced spend on marketing and promotions where demand and capacity were sufficient.
- The operations team were able to balance staffing levels between customer service and cost by having a more accurate view of demand.
- The restaurants were able to optimise capacity for the first time by understanding occupancy trends and adjusting layouts at key points so that all tables were occupied and speed of service increased.
- With so much more visibility over site performance, the management team had the confidence to make investment and divestment decisions, giving them greater certainty and stability for the future.
We worked with the client to create a dashboard that forecast demand and capacity for every restaurant at any point of the day. Users could review this data at any level they choose.
The solution has a variety of technical assets:
It integrated data from different internal systems: (Booking, Sales, Email System, Loyalty Databases, Web, App, Operational Guidelines, Property Data) We worked with structured data (e.g. booking times) and unstructured data (e.g. guest requests), processing unstructured data using Natural Language Processing (NLP). This meant that data points could be combined for more accuracy. For example, particular guest requests could ensure additional seating time was allocated to tables.
- The solution we built captured, processed and integrated external data at a site level, including weather and local events, using NLP to codify unstructured data.
- These different data points (Integrated data, internal and external) were then processed using machine learning (ML) to create accurate demand and capacity forecasts.
- From this, we developed dashboards with user interfaces designed with a variety of different roles and use cases in mind.
- We continually refined the algorithms we used for the demand and capacity forecasting, by monitoring actual restaurant performance and using the data in our machine learning models.
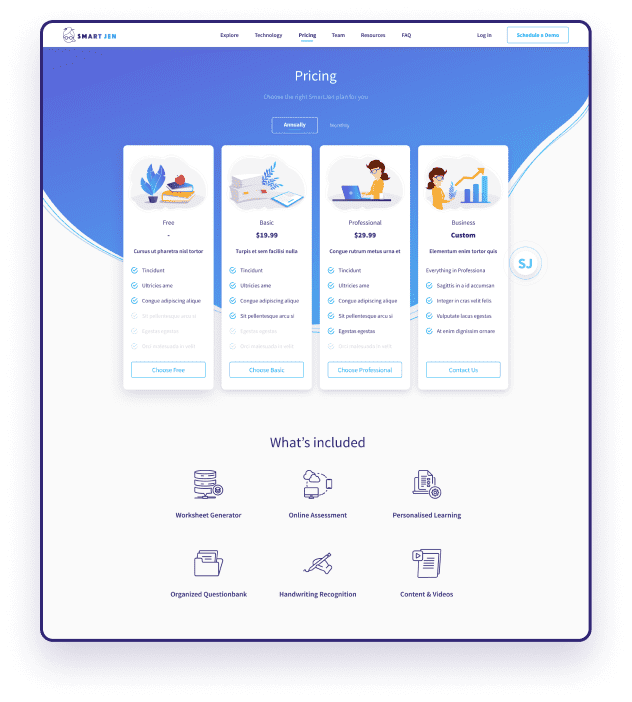
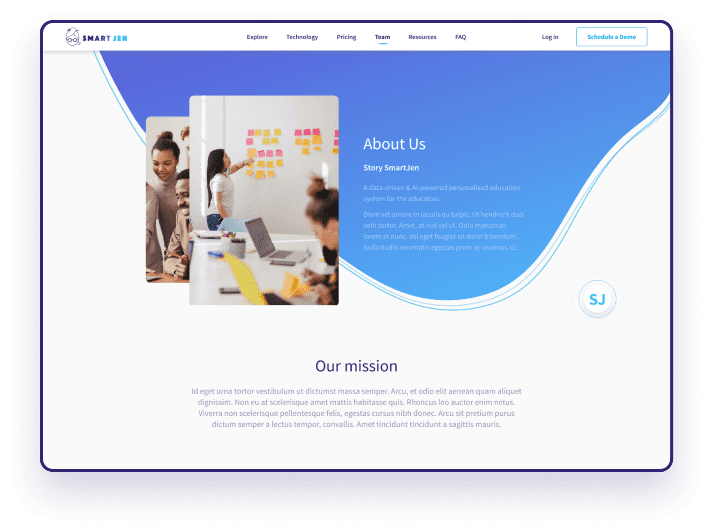
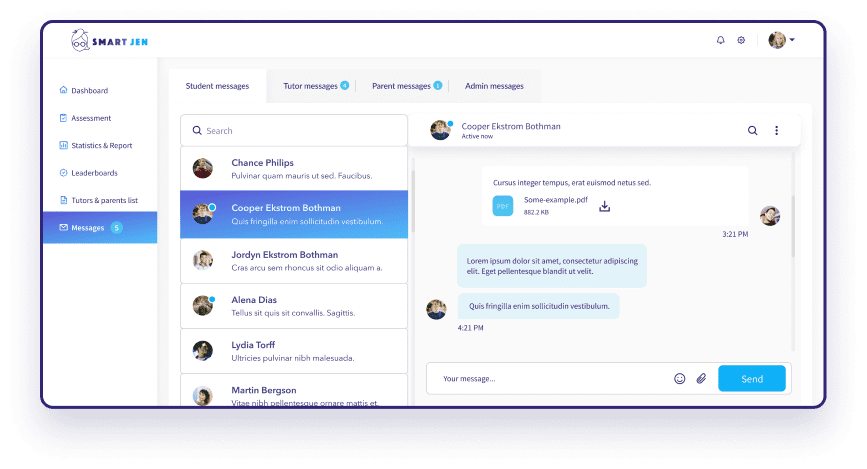
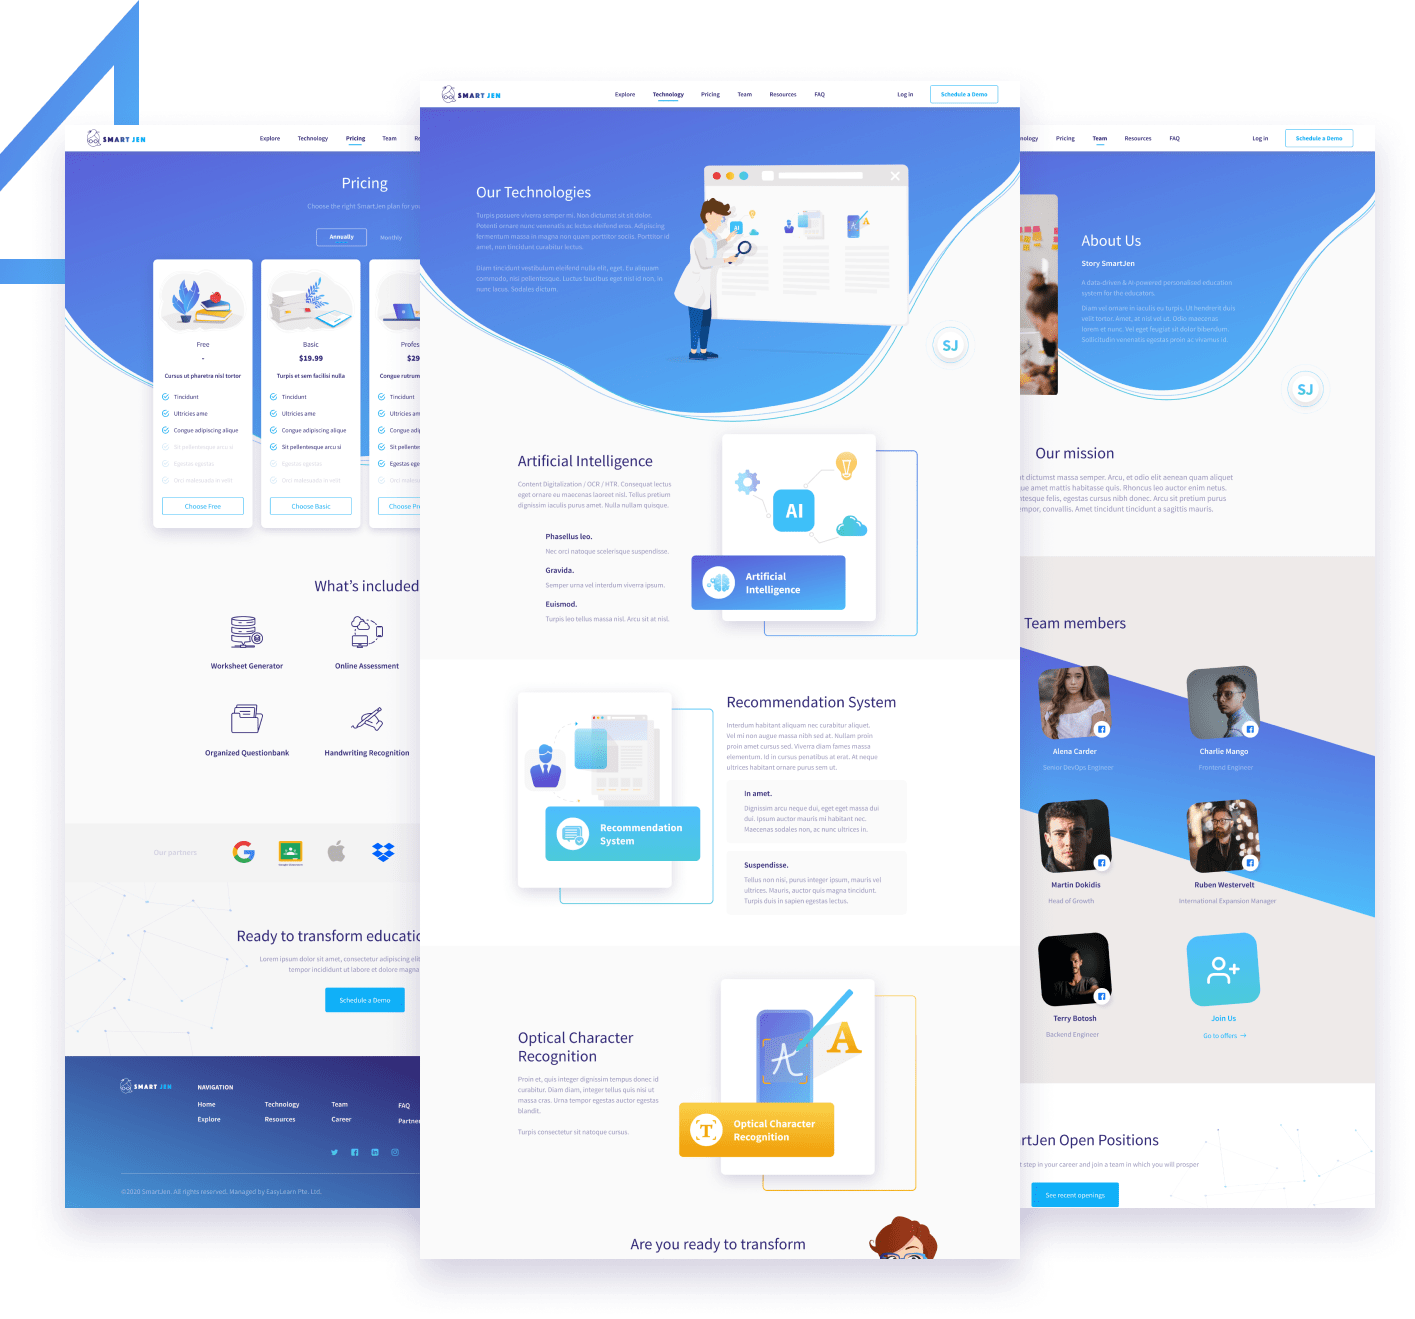
SmartJen
Development of a new web portal with a simple user interface, coupled with color scheme and modules matching the brand colors and latest design trends incorporated to give a modern, but trustworthy look and feel.
We were equipped with a clear vision of SmartJen’s unique value proposition thanks to versatile users and market research. Evaluating the problems of the existing platform we realized how to make customers’ journeys more convenient and smooth and improve user flows. Considering the challenges of students and teachers in their remote learning management operations we embodied the vision leveraging the following steps:he client had three main objectives for programme.
The Challenge:
SmartJen empowers students to go through their learning journeys easily, check results, and track their achievements via a customizable dashboard. Teachers can create and manage students’ lists, groups, and worksheets with assignments, track course completion, and compliance. With a collaborative approach, parents are granted access to have control over their children’s learning processes.
The Solution:
SmartJen came to Northell to improve their existing web platform by suggesting new and advanced features to make the user experience more seamless. Furthermore, SmartJen’s existing website was required to be updated and redesigned according to new design trends and best practices. Create a new web portal with to navigate, simple user interface, coupled with color scheme and modules matching the brand colors and latest design trends incorporated to give SmartJen a modern, but trustworthy look and feel.
The Results:
+0%
Increase in traffic
Stage 1: Product Technical Documentation.
During this stage, we collected all the relevant information from our client to develop a product as per his expectation and requirements. We wrote technical documentation and chose technical stacks: React.js and Node.js.
At this stage, we defined the requirements for functionality (requirements for the admin panel) and user roles (admin and super admin). We also finalized the estimate and scope of work.
Stage 2: Development.
Our front-end developers were responsible for the client side of the application. Back-end developers were responsible for API and database development. We tested every new feature released. The DevOps team worked on the CI/CD process.
Stage 3: Testing.
QA engineers tested all delivered code and carried out manual testing for developed components.
Stage 4: Product Deployment & Integration.
After the development and regression testing from the QA team, we switched to production deployment and integration. The tested version of the product was delivered to the users for beta testing. The team collected user feedback, fixed all the bugs, and implemented some improvements.
RhinoDox
Using a simple, yet scalable CMS solution like WordPress to develop a frontend with complex modules.
RhinoDox is a construction bid and proposal management platform that helps teams create data and process automation that allows generating bids with greater consistency — faster — and delivering the analytics people need to make informed decisions. Using a simple, yet scalable CMS solution like WordPress to develop a frontend with complex modules in the backend using latest technologies, but with ease of use drag and drop functions for the administrators. We knew that the needs of the customer would be critical to the success of this app, so we began with a discovery phase, conducting interviews and gathering feedback from potential users and stakeholders. This enabled us to create customer personas to help us understand how and why customers would be using the app.
The Challenge:
Creating a complex but easy-to-use platform from scratch Our team needed to make custom software for RhinoDox, which could transform into SaaS over time. We examined the entire workflow and, together with our partner, came up with a system for optimizing and automating processes with the help of custom software. Our partner wanted a user-friendly product with diverse functionality that would cover all the users’ needs and would work smoothly and quickly. The main challenge for our team was to understand the idea of the platform, the interaction between the primary personas of the platform and the main product goals. User Testing helped us to cope with this challenge.
The Solution:
Use a simple, yet scalable CMS solution like WordPress to develop RhinoDox frontend with complex modules in the backend using latest technologies, but with ease of use drag and drop functions for the administrators. Using various backend technologies to build a cloud-based business automation platform to improve team collaboration and speed up project management as well as building security functions for low latency platform which can be accessed from anywhere at low bandwidth speeds.
The Results:
£0
Revenue within one year of new platform
Design System
For RhinoDox, we developed a new design system. RhinoDox had its company’s brand colors, but together we decided to change everything and create a new platform style. As a result, we made the platform more attractive and modern.
UI Design
The UI design of the platform was supposed to be calm, neat and minimalistic. We focused on the fact that people will work on the platform for a long time.
Therefore, we chose blue as the main color for the platform. This color conveys reliability, calmness and does not irritate the eyes. It was also essential for us to add air to those platform pages where there is a lot of data and numbers. Everything had to look neat and not confuse the user.
The Calendar
For RhinoDox, we developed a new design system. RhinoDox had its company’s brand colors, but together we decided to change everything and create a new platform style. As a result, we made the platform more attractive and modern.
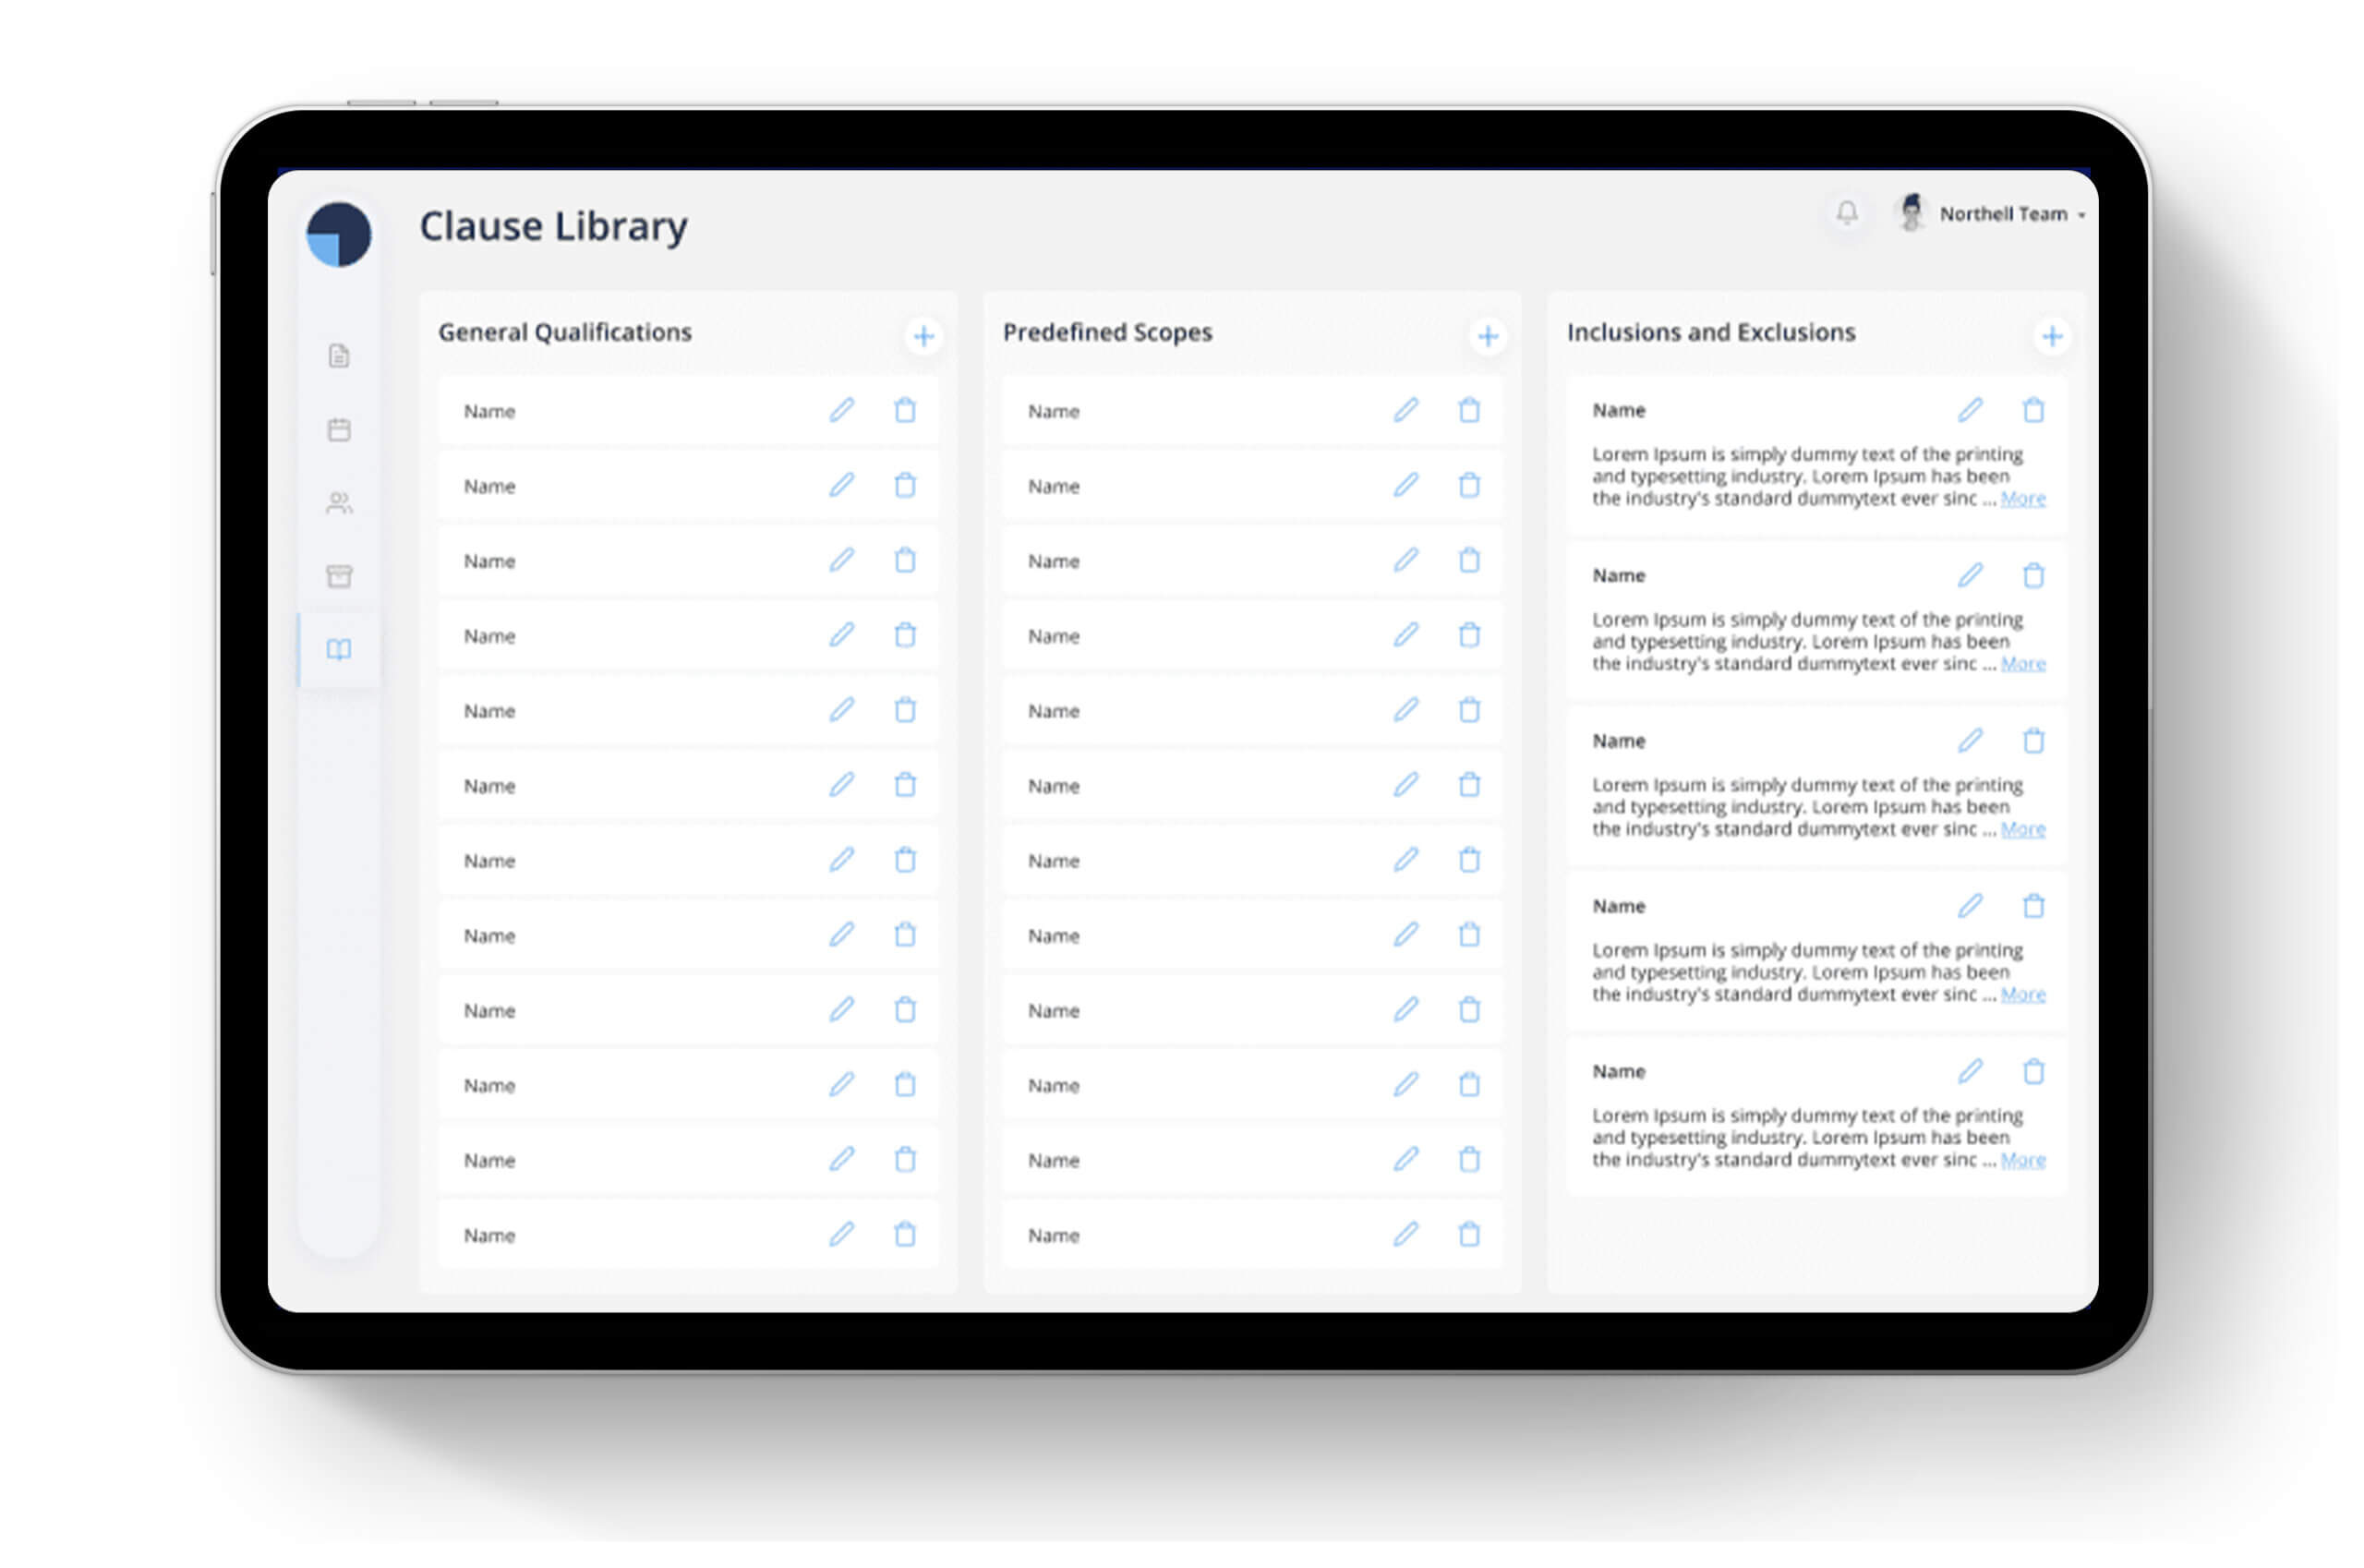
Clause Library
The library contains data that users can use to set up workflows on the platform. The library contains the following data: General Qualifications, Predefined Scopes, Inclusions and Exclusions.
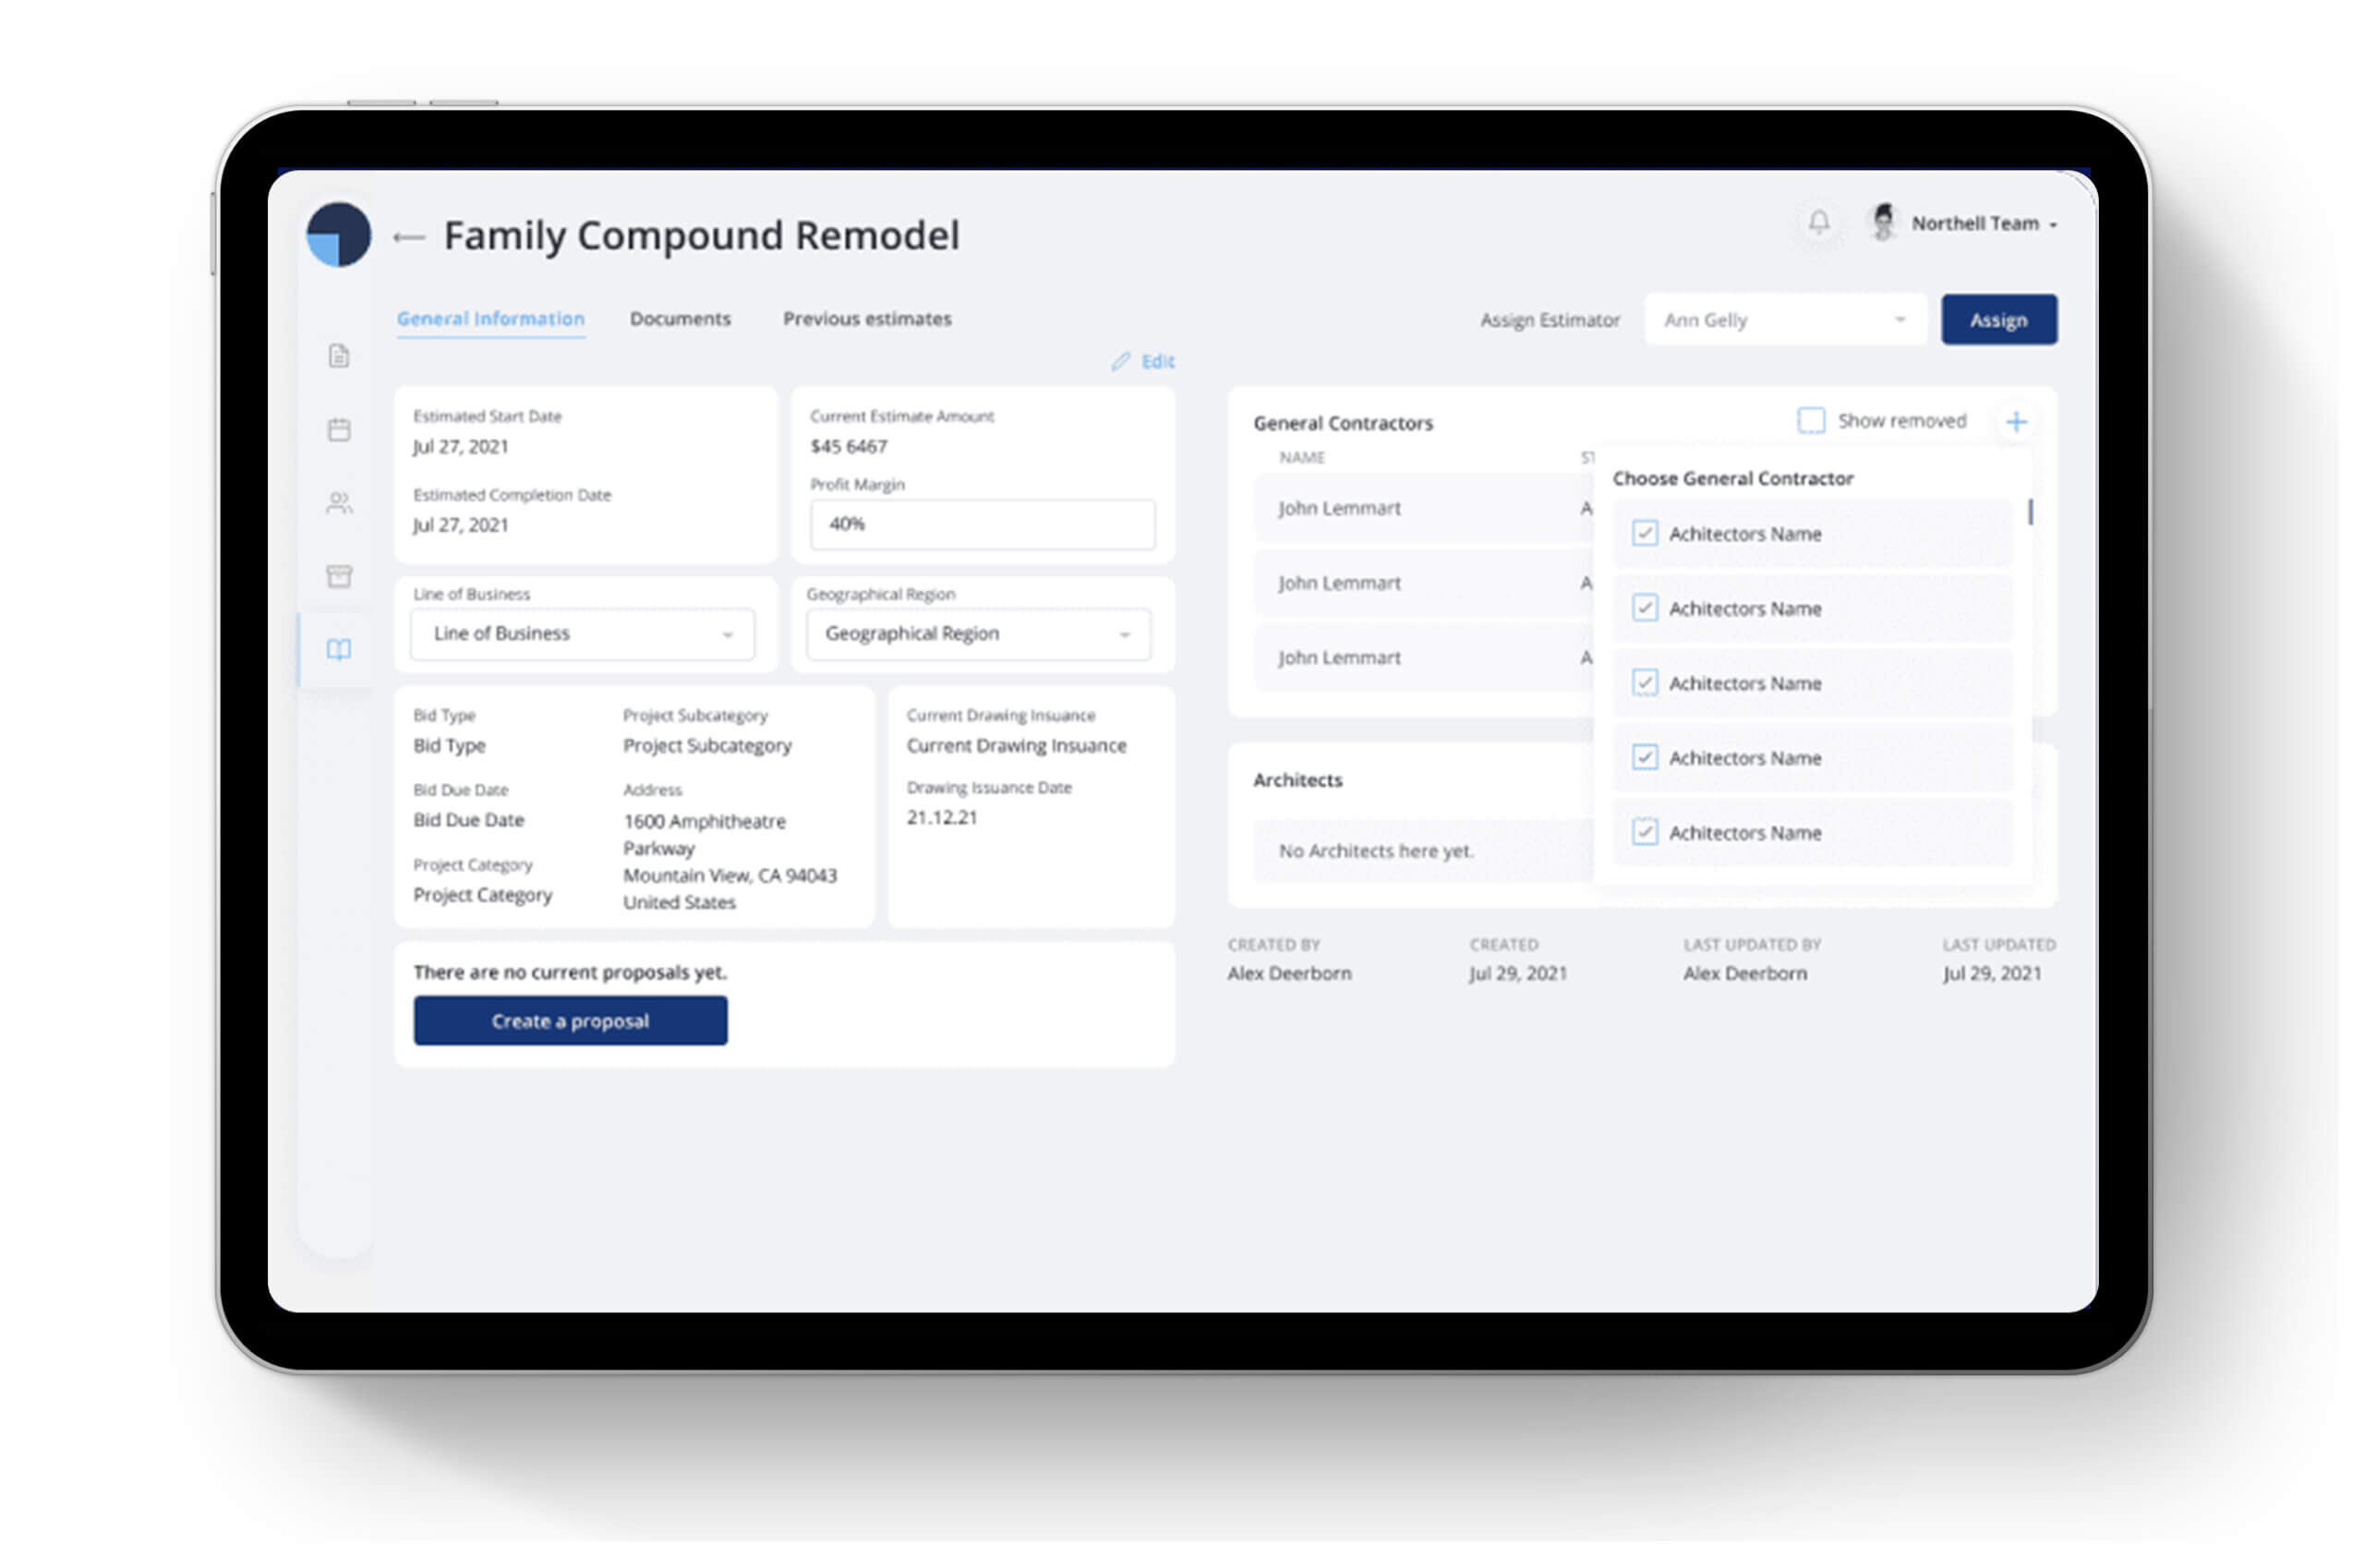
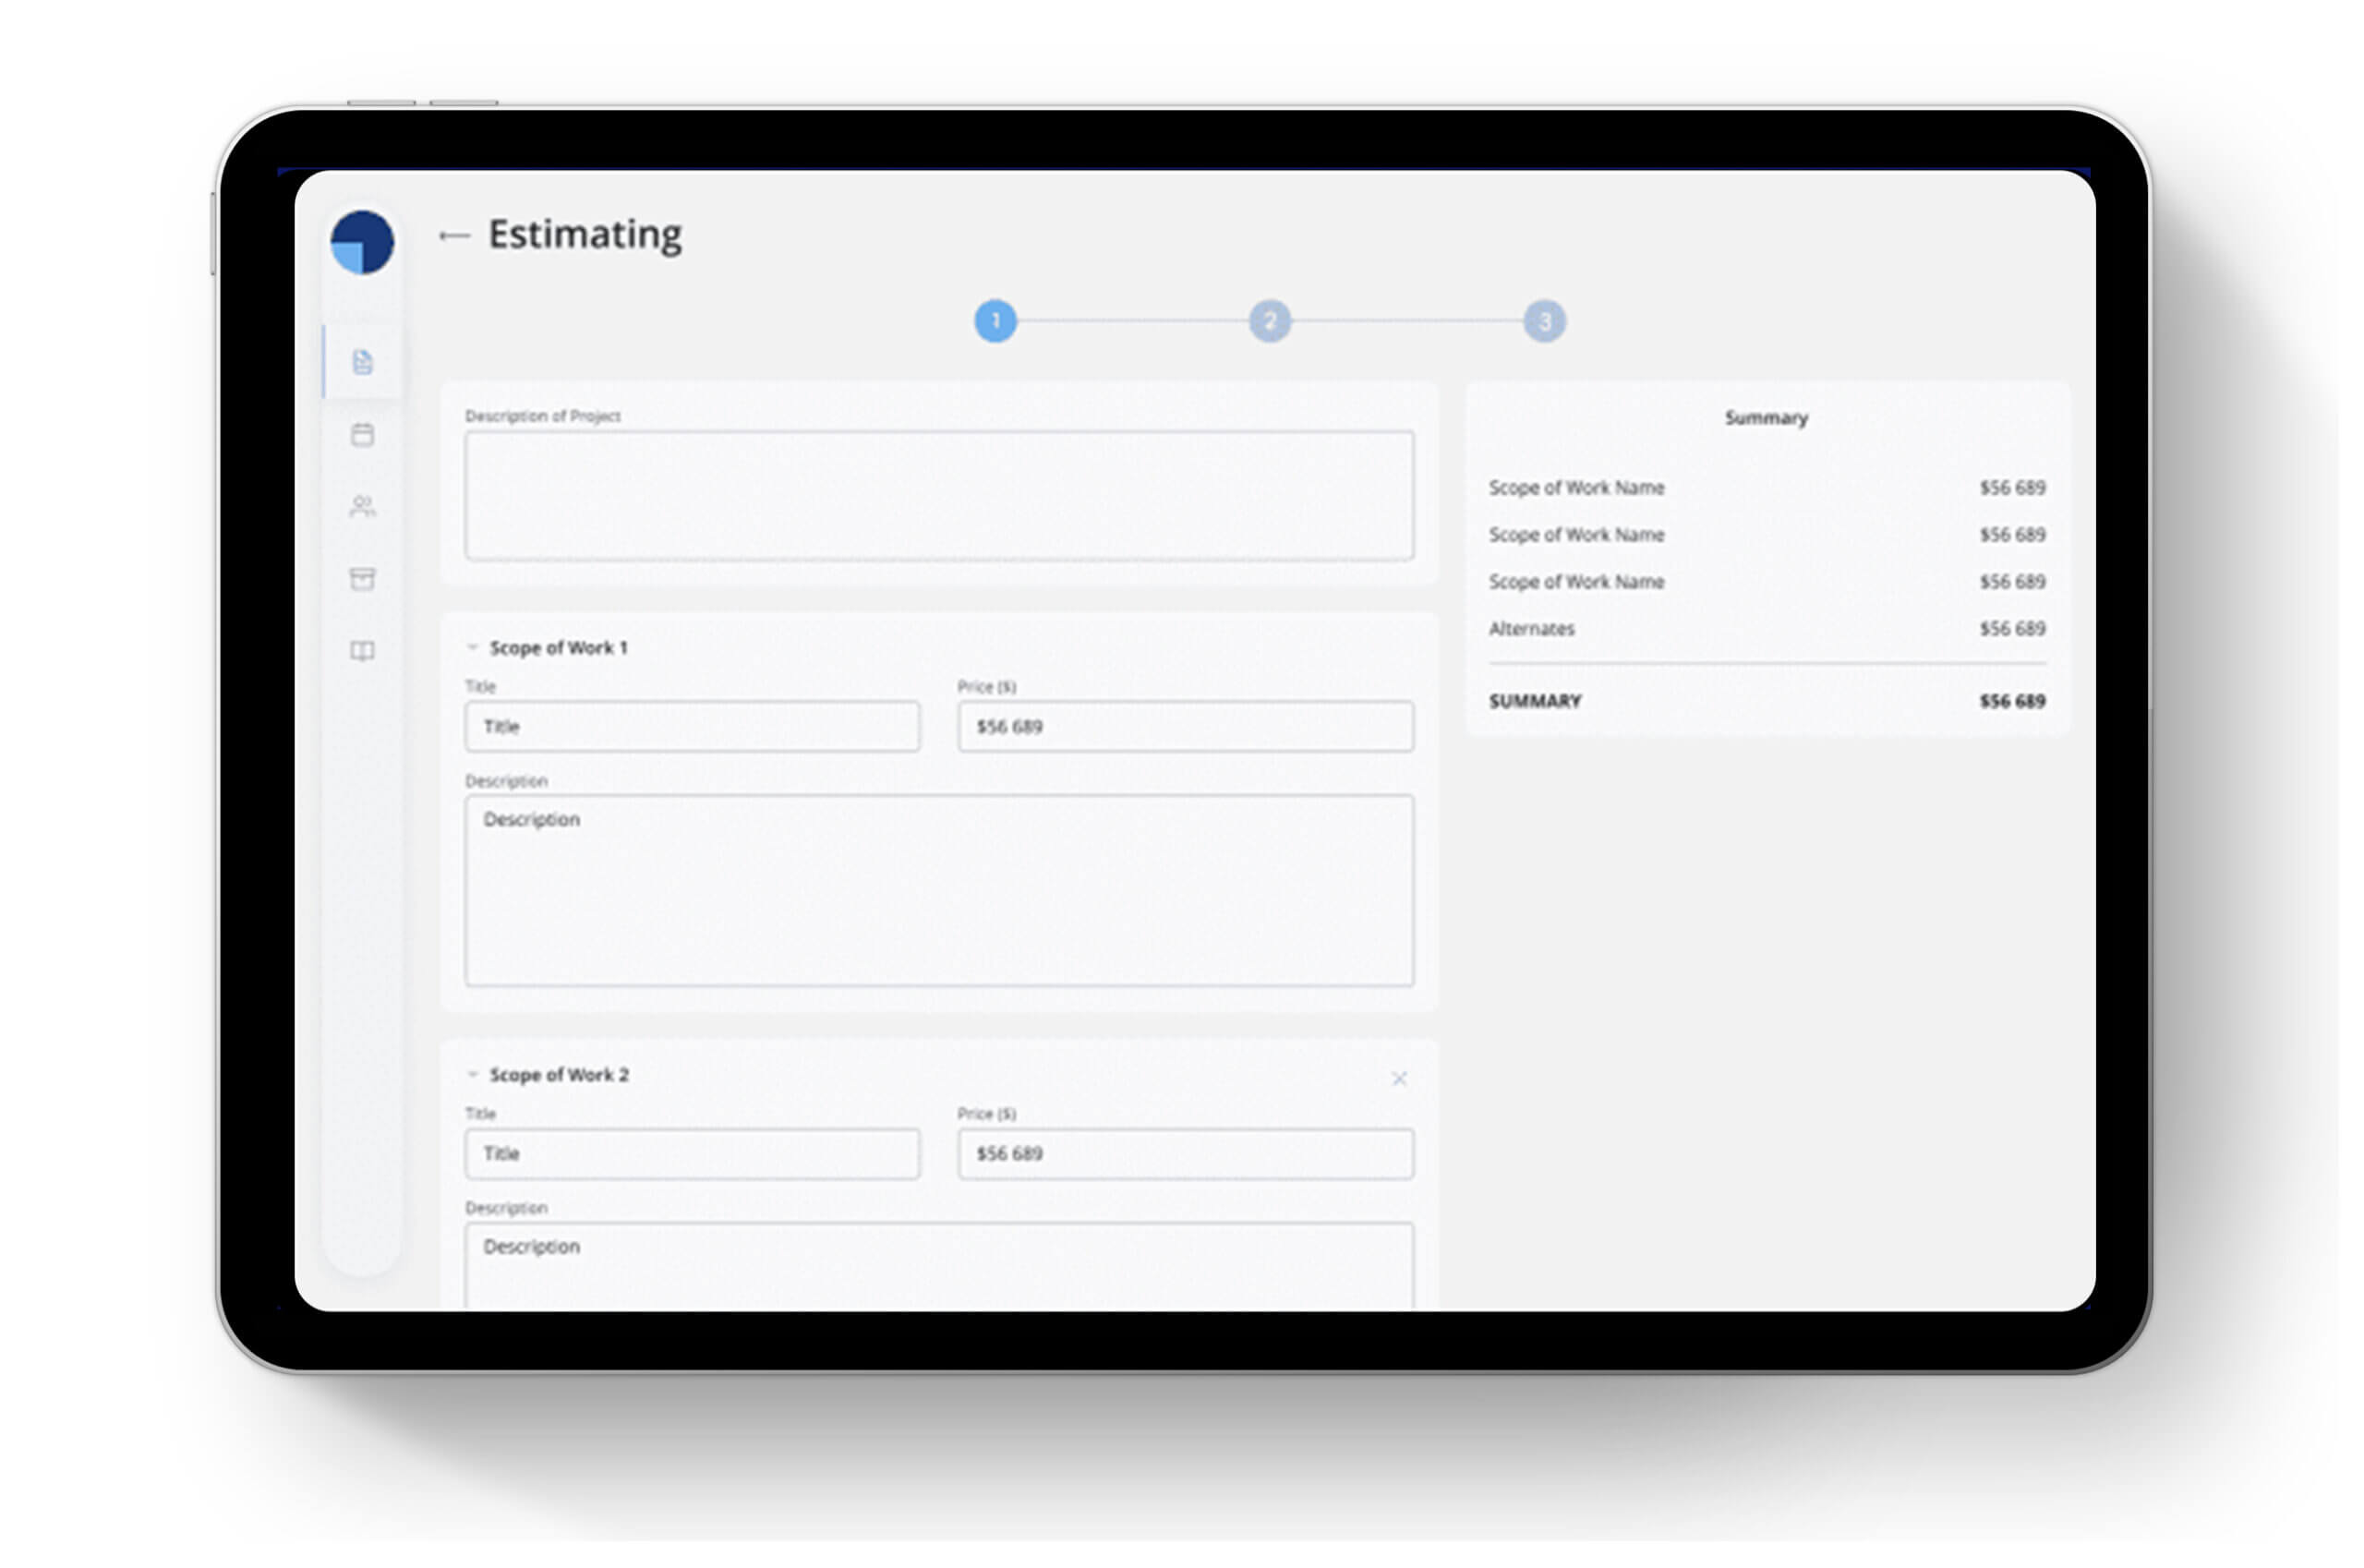
Project Lists
This section contains all detailed information about the projects. The user can filter projects by various criteria, view project estimates, add documentation, add and remove contractors, and much more. In fact, this section was created to manage all projects that are being worked on.
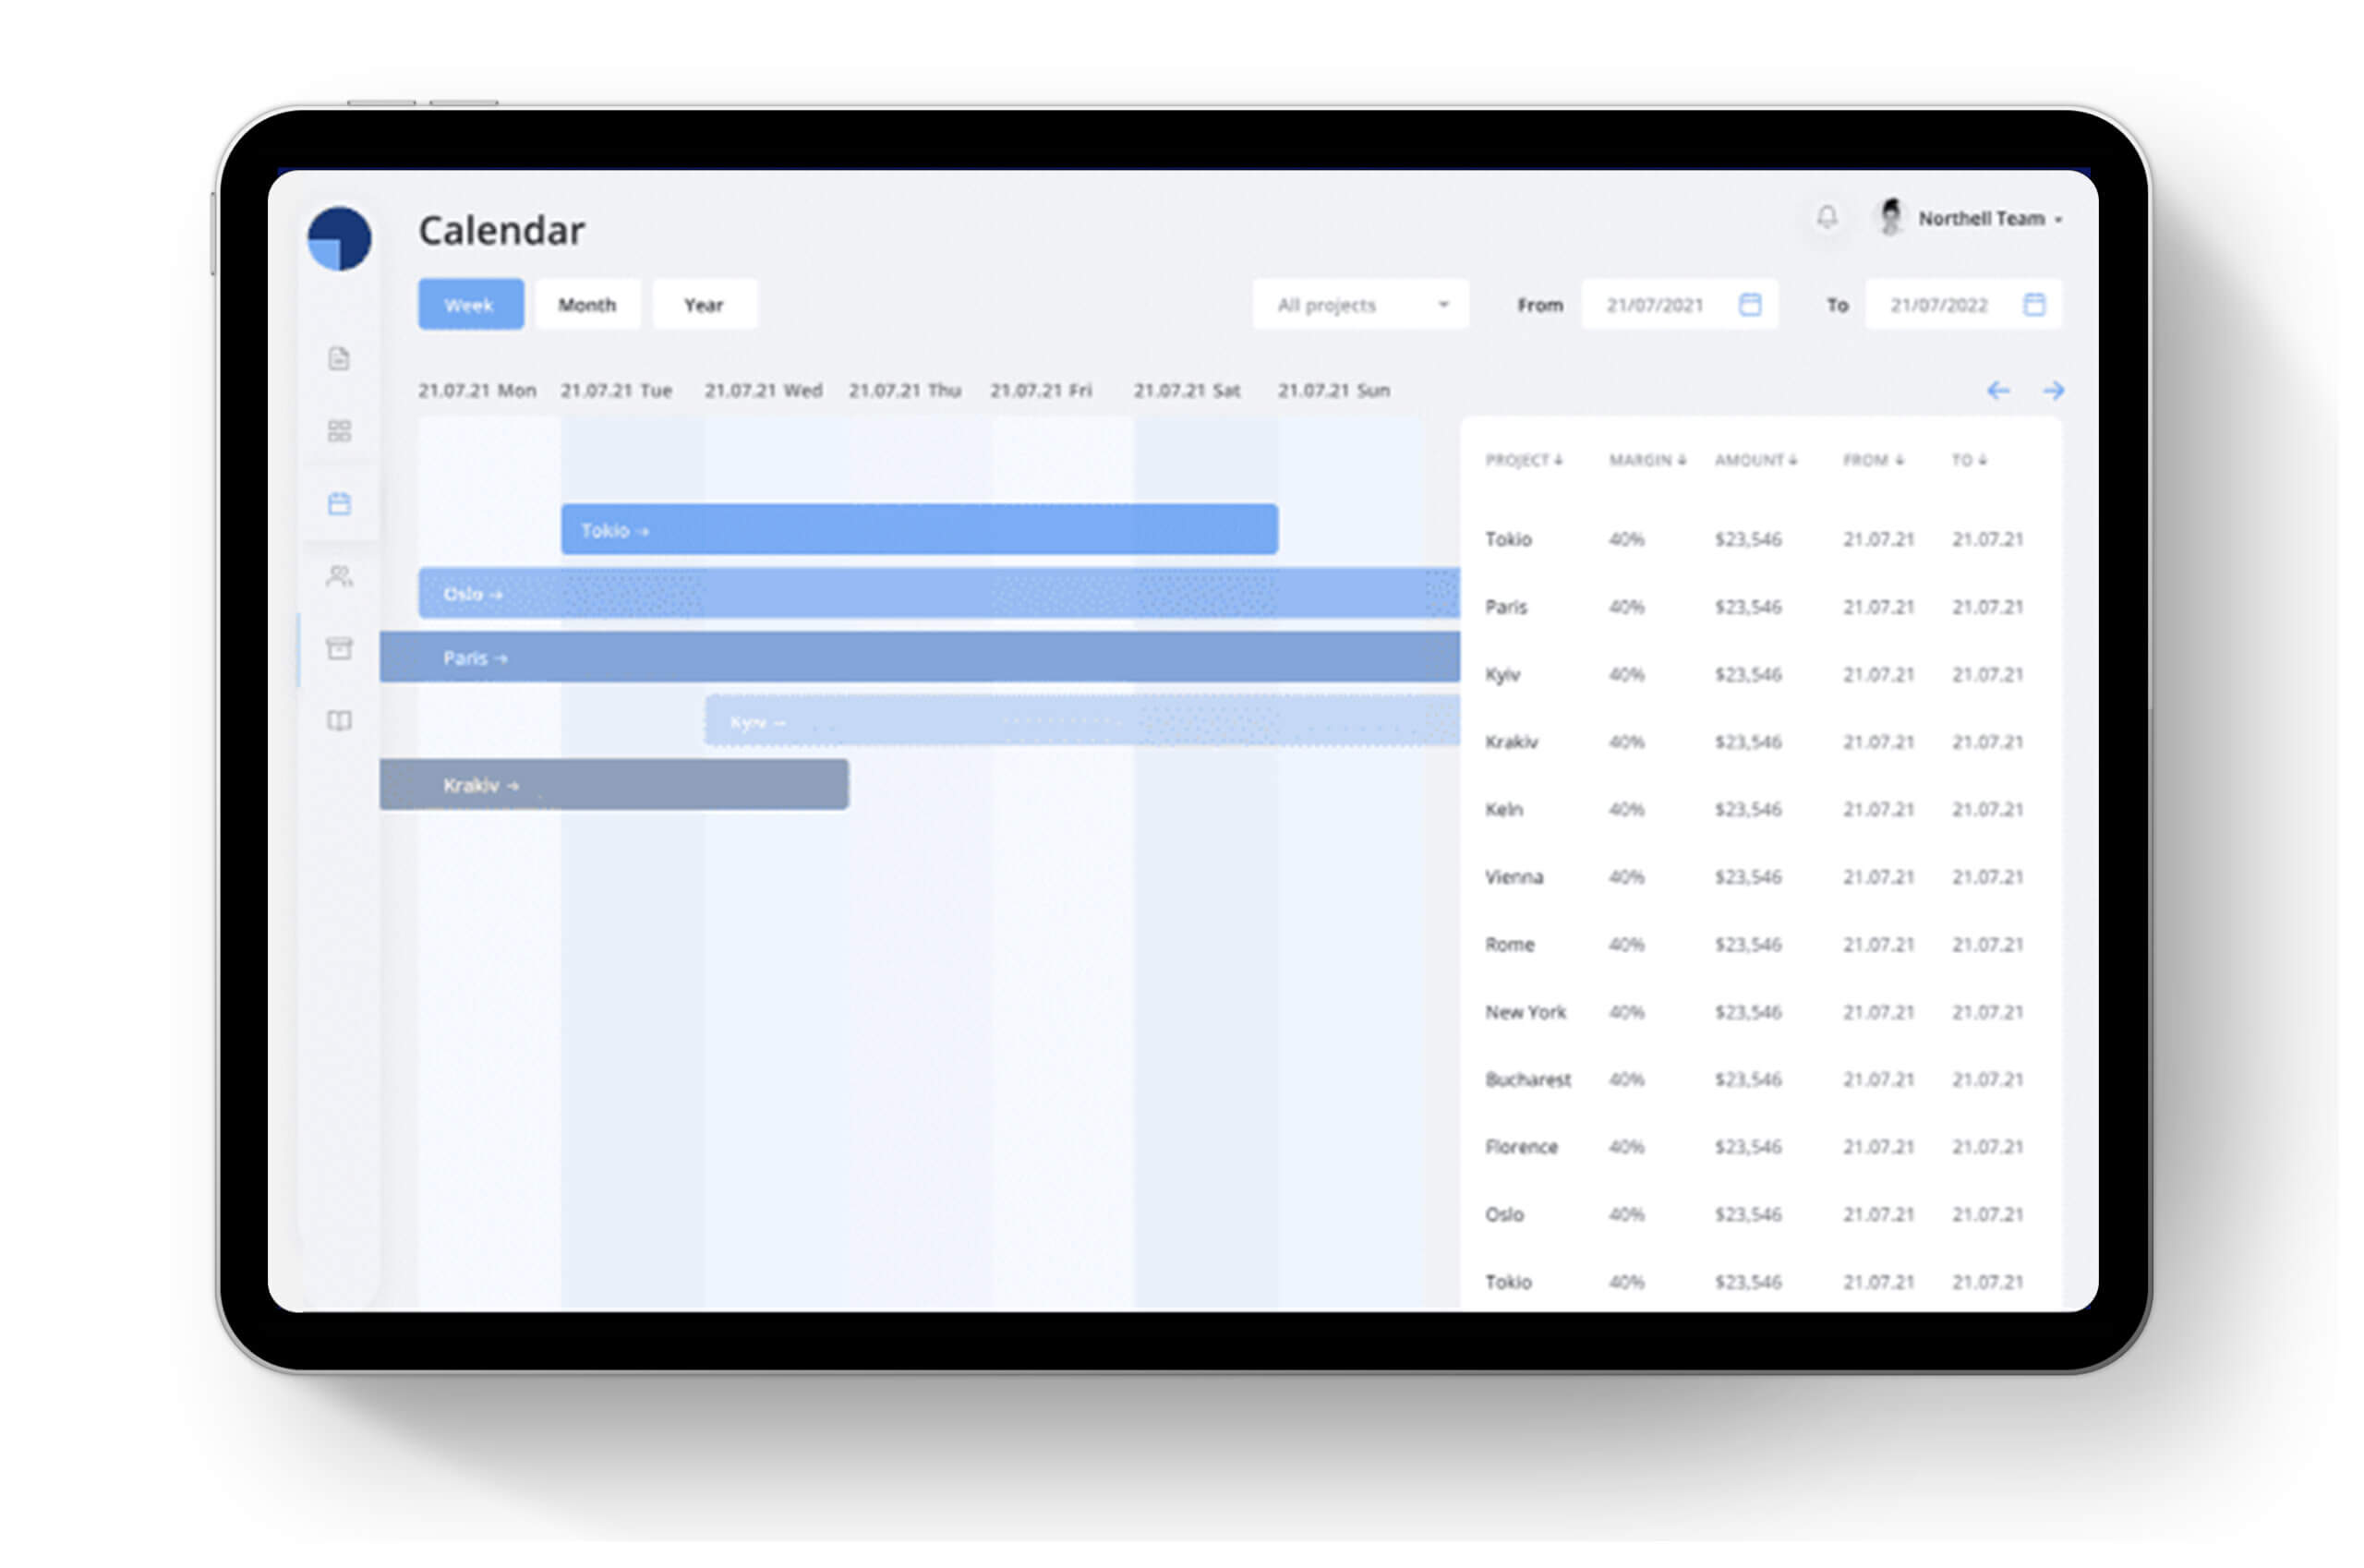
Calendar
The calendar displays the start and end of the project. Also, using the calendar, users can find out the cost and profit of the project, its duration, location, etc. All previously completed projects are saved in the calendar, and users can easily find the project they need by entering the date.
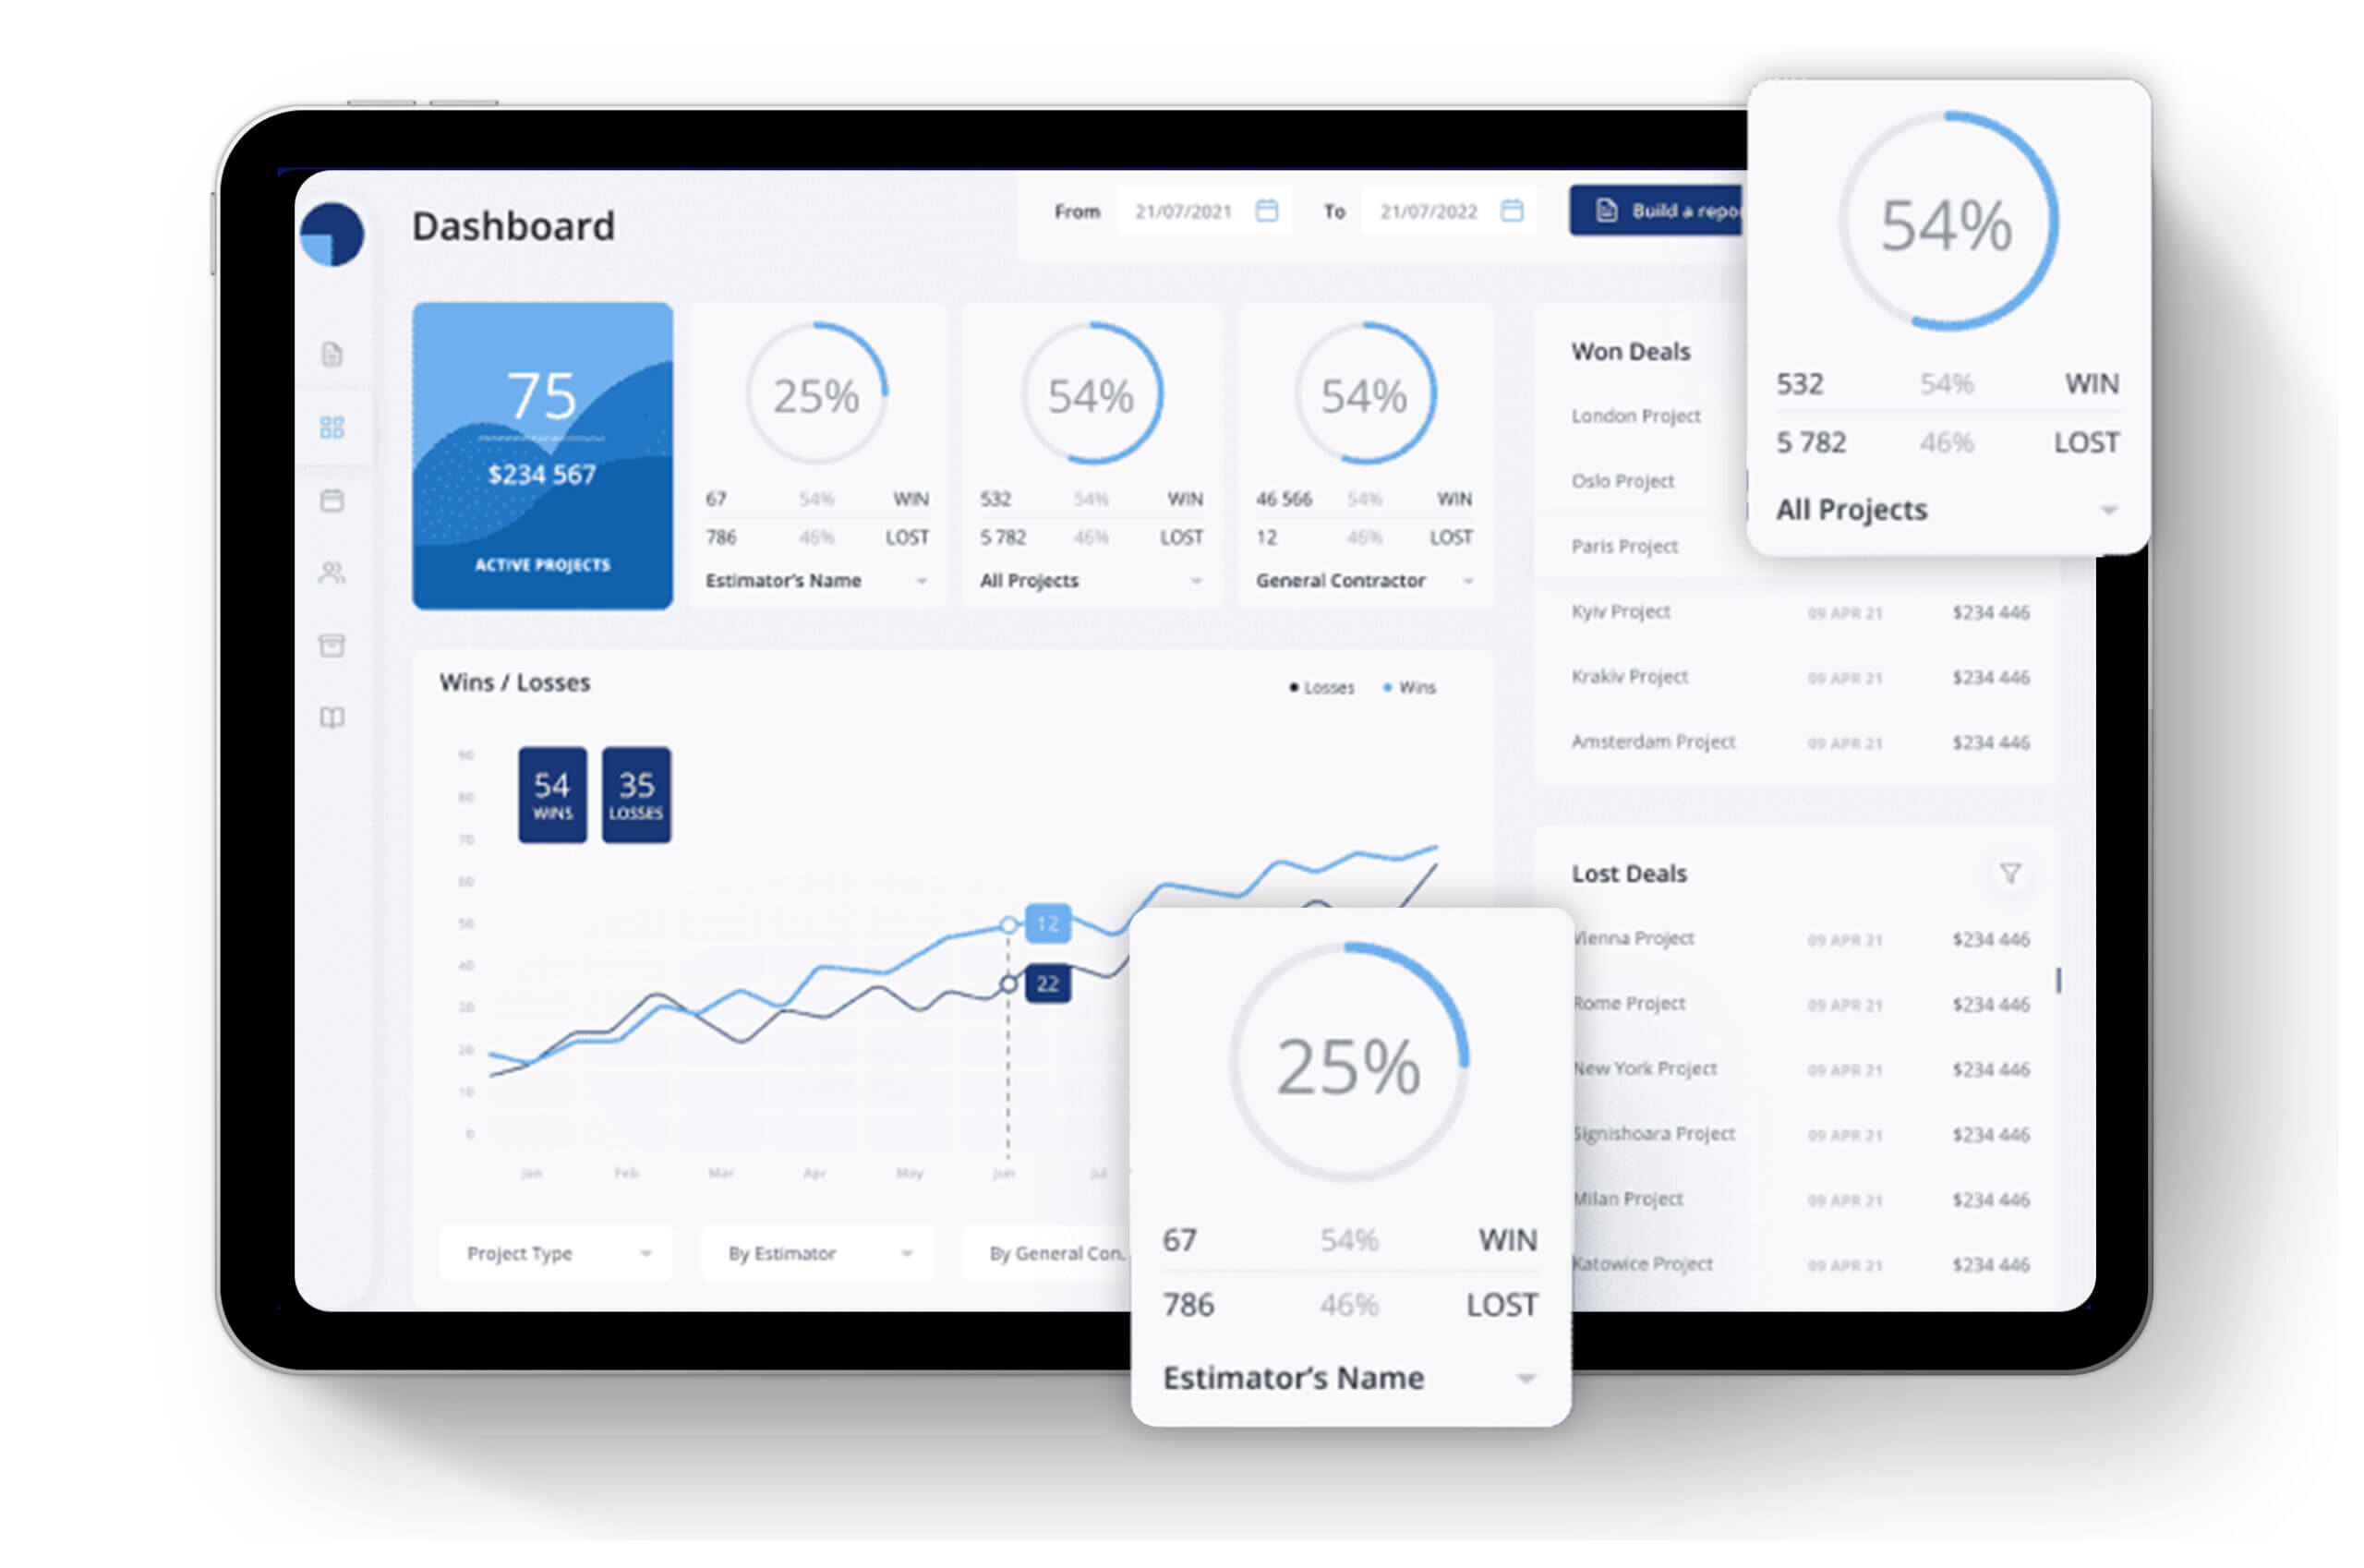
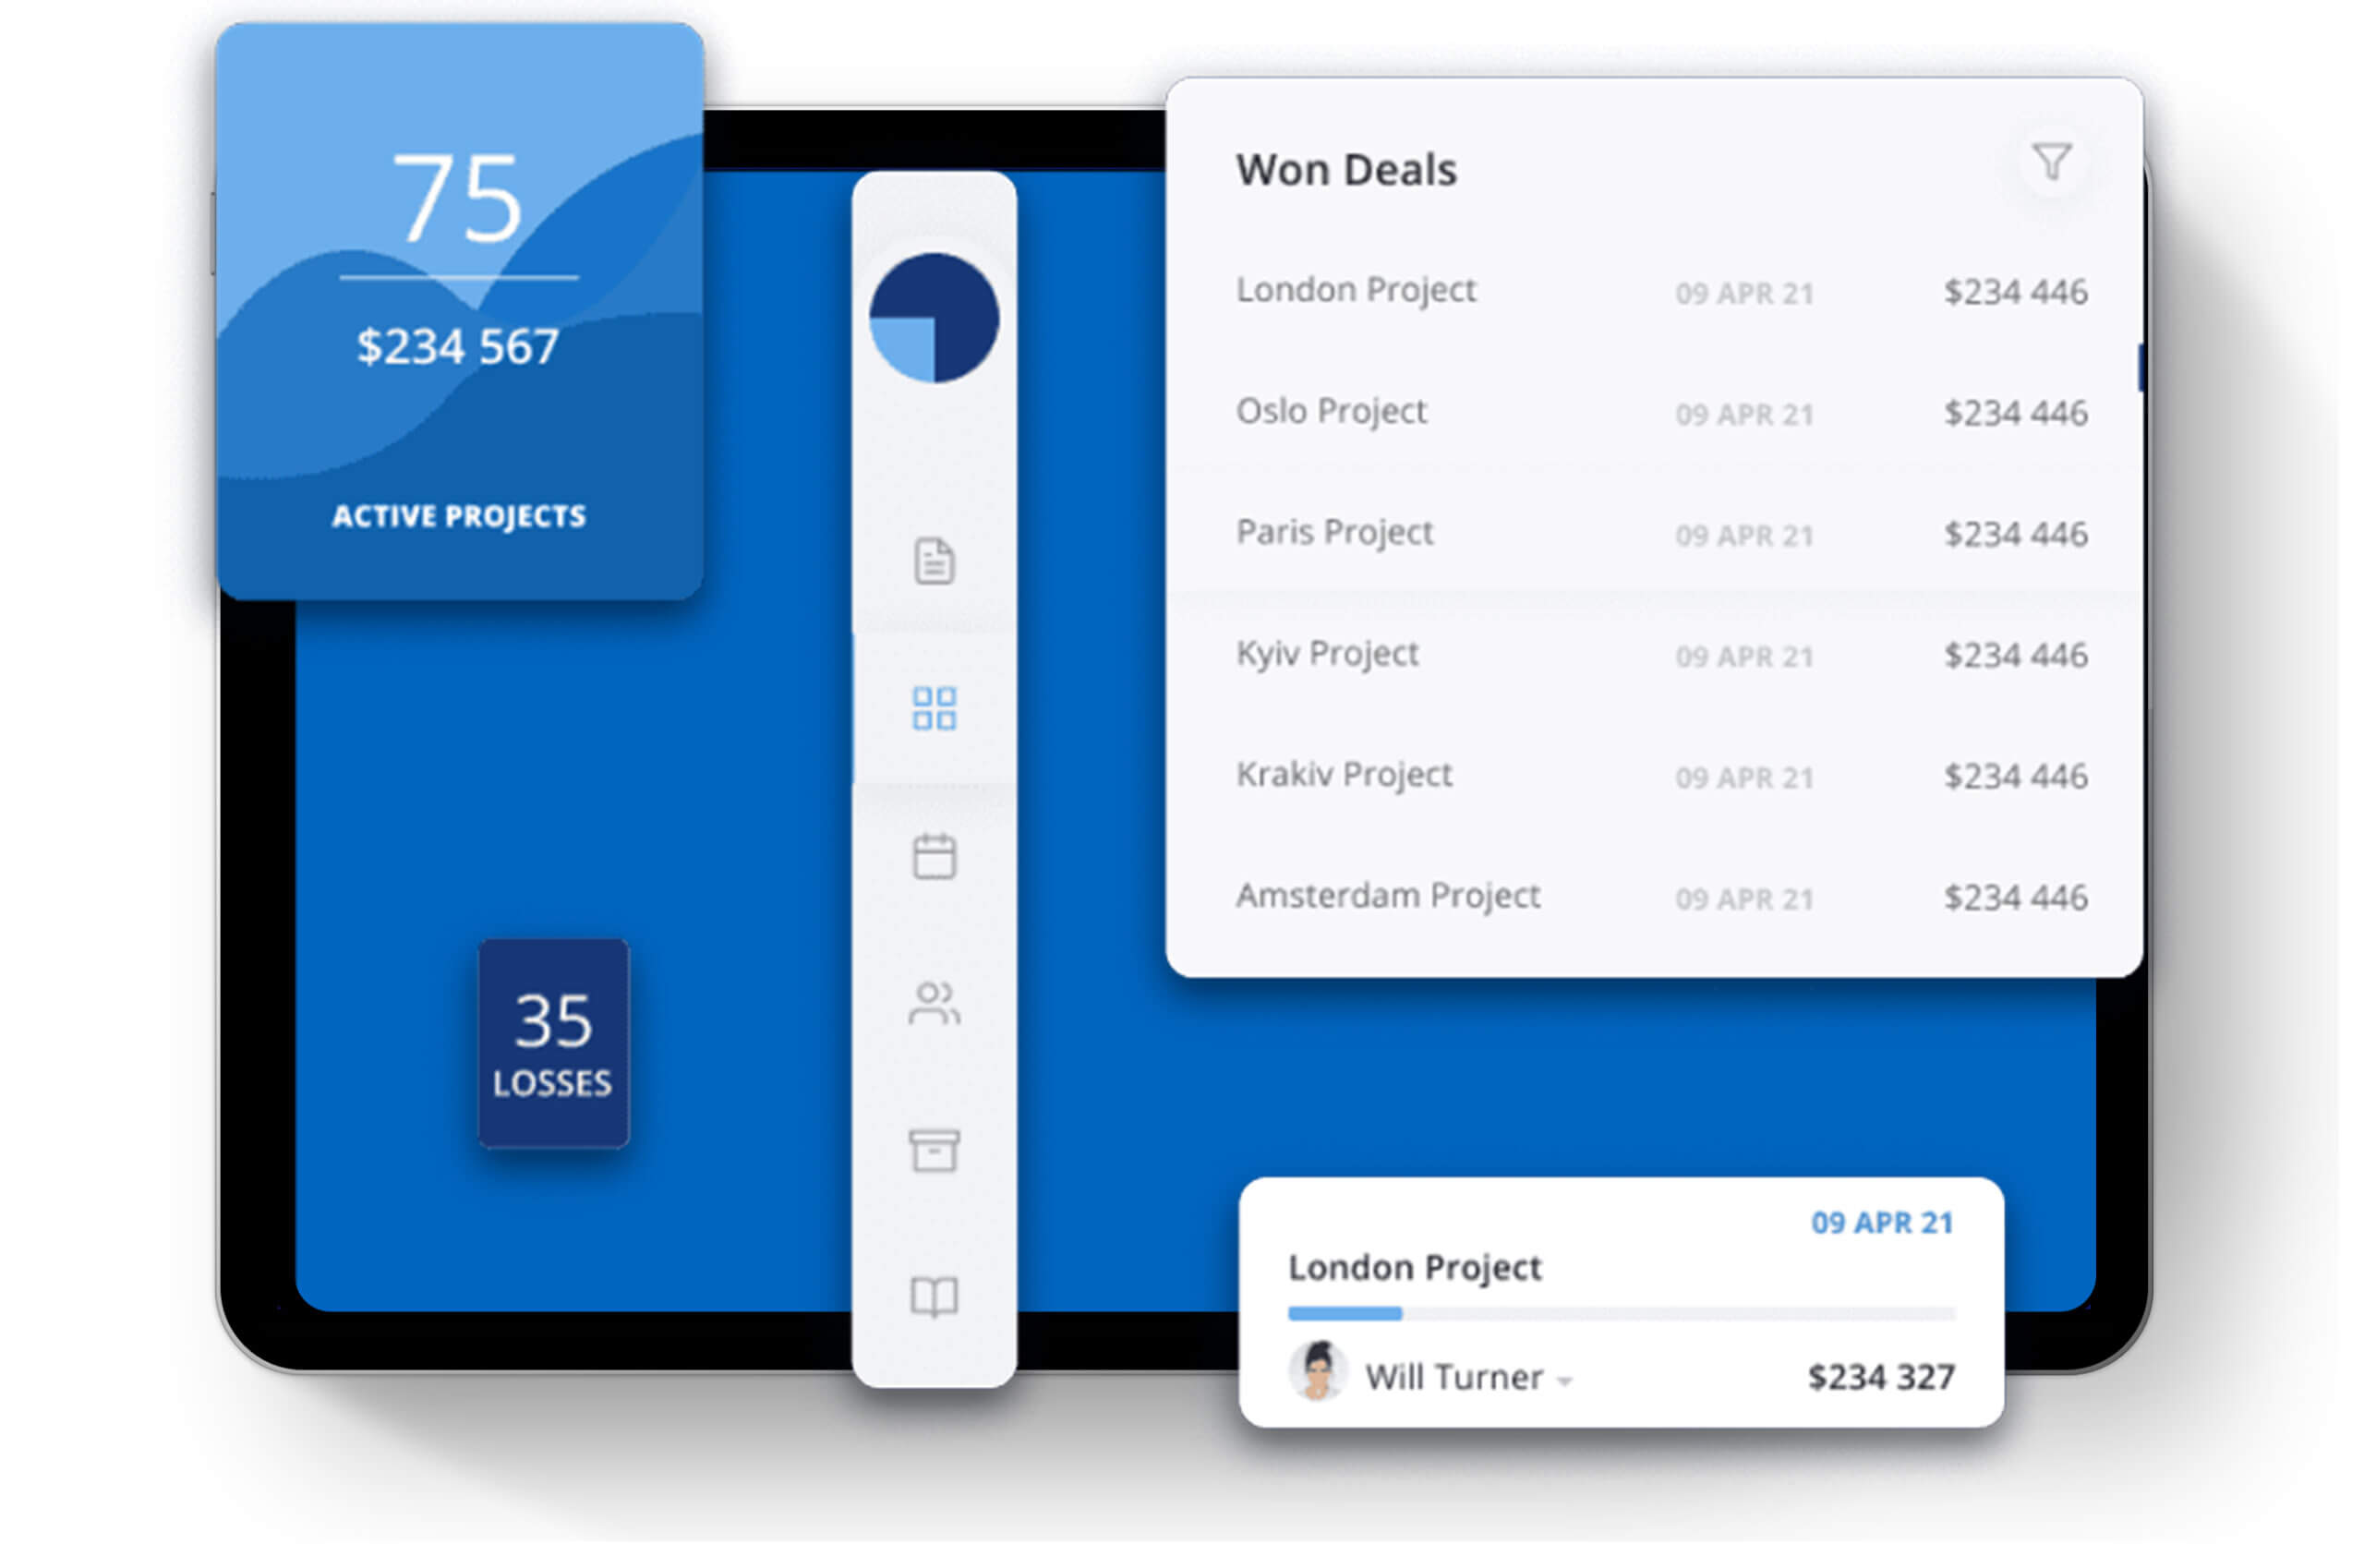
Manager Dashboard
The manager’s Dashboard shows the total number of active projects and their total cost. Also, on the Dashboard, the manager can analyze the Wins/Losses chart.
On this graph, users can sort projects by their type, estimator or general contractor. Won deals and lost deals are shown in a separate section on the Dashboard. Also, being on the Dashboard, managers have the opportunity to create a report.
Development
Our front-end developers were responsible for the client side of the application. Back-end developers were responsible for API and database development. We tested every new feature released. The DevOps team worked on the CI/CD process.
Our team also developed the REST API. When creating the REST API, we used generally accepted practices such as:
Archiving large blocks of data
Using the secure HTTPS protocol
Applying as manyHTTP codes as possible
Testing
QA engineers tested all delivered code and carried out manual testing for developed components.
Deployment
After the development and regression testing from the QA team, we switched to production deployment and integration. The tested version of the product was delivered to the users for beta testing. The team collected user feedback, fixed all the bugs, and implemented some improvements.
Maintenance
After deploying a RhinoDox product on the production environment, if any issue comes up and needs to be fixed or any improvements are to be done is taken care of by the Northell development team.
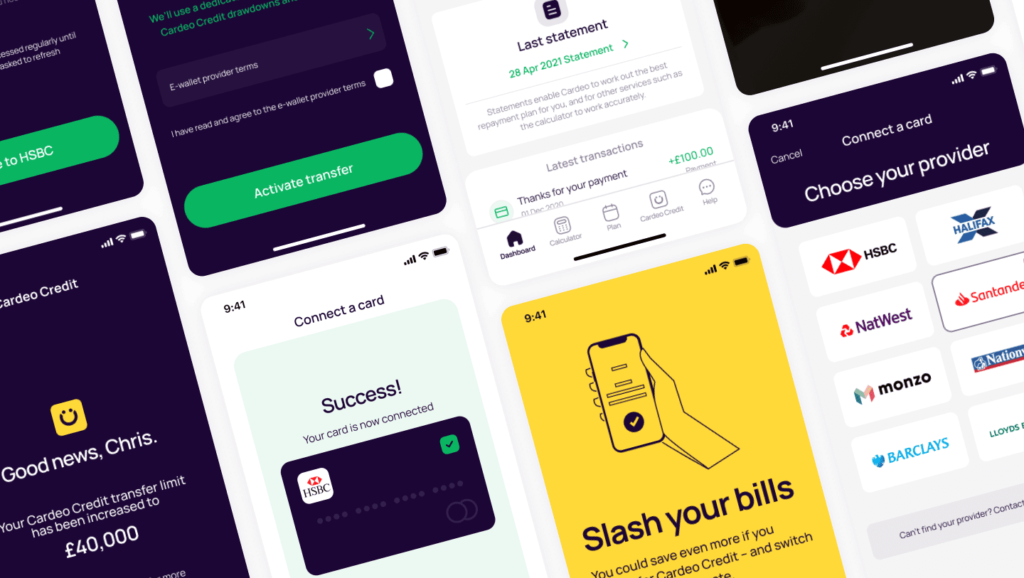
Cardeo
Designing an advanced application that manages credit card repayments to save clients time.
Cardeo was founded to tackle the problem of credit card debt.Combining open banking data with artificial intelligence to beat thedownward spiral, their aim is that people pay less interest, no morefees, and are able to pay off their credit card debt without hassle. The main challenge for our team was to make complex functionality easy to understand for users. We also needed to make the application compact but perform many different functions.
To do this we used agile working and short sprints so that we could complete work and gather feedback on each section that we built, making improvements as we went along.
For the Cardeo App, we developed a design system from scratch. Our team created all elements for the platform, including icons, headings, drop-downs, inputs, buttons, and graphs. We wanted the app to be as user-friendly and self-explanatory as possible, so kept the designs clean and simple.
The Challenge:
Take the client’s vision for a simple but advanced application, and create a user-friendly app that manages credit card repayments to save clients time, money and hassle.
The Solution:
Create a user-friendly card managing application with advanced features that enables the client to engage with their customer base as well as raise funds.
When Cardeo approached us, they had the concept for an app. Their vision was a simple, user-friendly application that would help people to pay off their credit card debt quicker, reducing the interest and the fees they would pay. They had some preliminary design ideas, so we took this, along with the concept, and created an agile roadmap, to ensure we could be responsive as the concept evolved. We knew that the needs of the customer would be critical to the success of this app, so we began with a discovery phase, conducting interviews and gathering feedback from potential users and stakeholders. This enabled us to create customer personas to help us understand how and why customers would be using the app.
We researched the market and competitors in the same space to help us make some decisions around necessary functionality and UX design. Based on the information architecture, we started to build wireframes for a better understanding of the structure of the app. Based on these wirefames, we created UI design to give a visual representation of the app.
Finally, we built a full a design system and framework to make sure there was consistency across the application, make additions easier, and speed up the process in the future. Finally, we built a full a design system and framework to make sure there was consistency across the application, make additions easier, and speed up the process in the future.
The Results:
As a result, we created an advanced but user-friendly card managing application. According to the first feedback from users, the application is convenient and covers their needs. Users can manage their whole account via the app. Additionally, the app works quickly and efficiently due to the development technologies we used.
+0
Increased conversion
UI Design
We worked with a design partner before we began the build. Together we decided on the appropriate colour scheme for the main app and all the accents. We decided to emulate the company’s logo colour in the initial pages, to build trust and familiarity while explaining the benefits and features of the platform. We used white space in the design to ensure that users wouldn’t feel overwhelmed by the design or features.
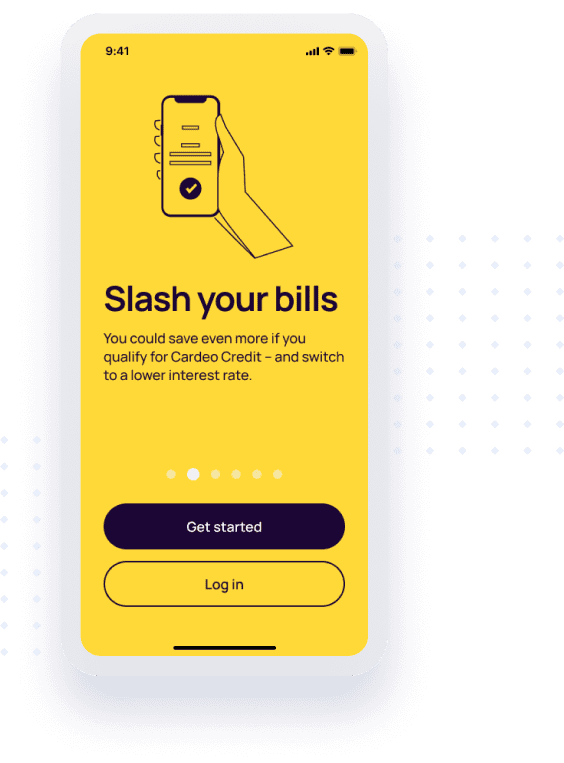
Onboarding
We created the application onboarding in two separate parts, a carousel for the first section so we could showcase the benefits and main features of the app, and then the registration page. For this section we worked with our design partner to strike a balance between slick registration functionality and a simple to use design. Again, we used white space where possible so as not to overwhelm users.
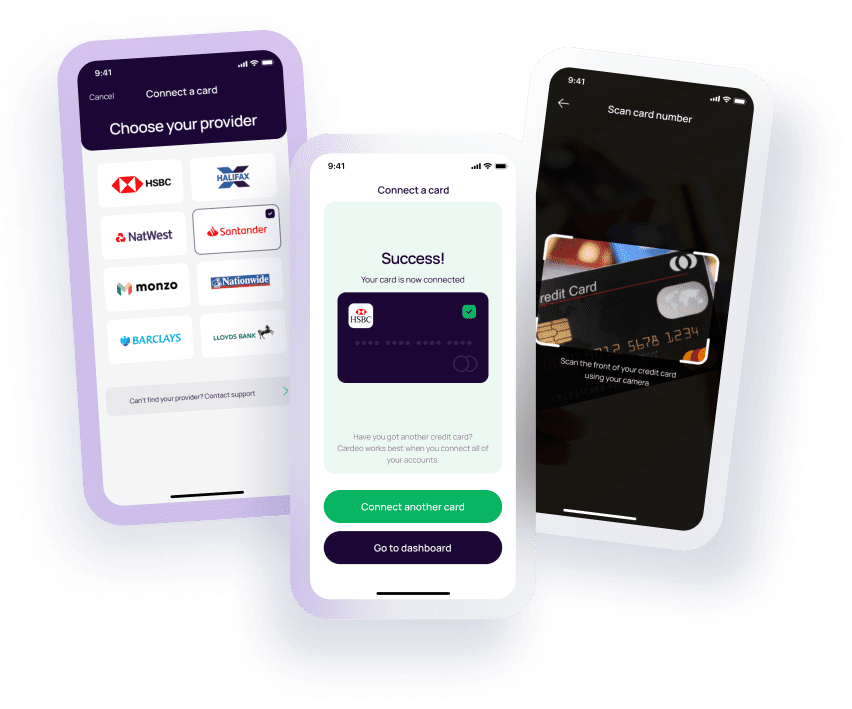
Card Connection
We created the application onboarding in two separate parts, a carousel for the first section so we could showcase the benefits and main features of the app, and then the registration page. For this section we worked with our design partner to strike a balance between slick registration functionality and a simple to use design. Again, we used white space where possible so as not to overwhelm users.
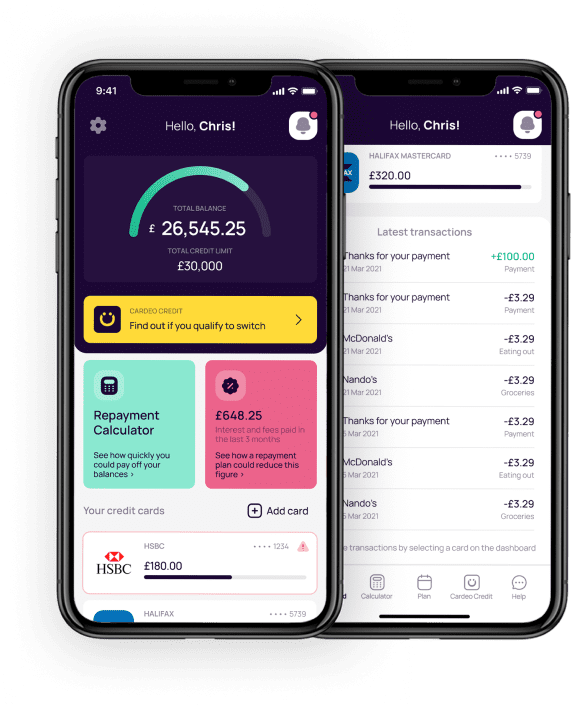
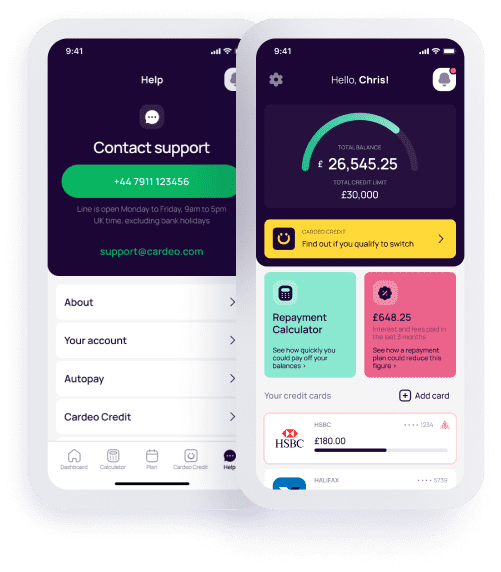
Dashboard
We designed the dashboard to be clear enough that users could see key information at a glance. With so much information to convey, including total balance, total credit limit, interest and fees paid in the last 3 months, their list of credit cards, and latest transactions, we knew the design would have to do a lot of heavy lifting to keep things clear and easy to use. We used icons and colour coded sections for added clarity.
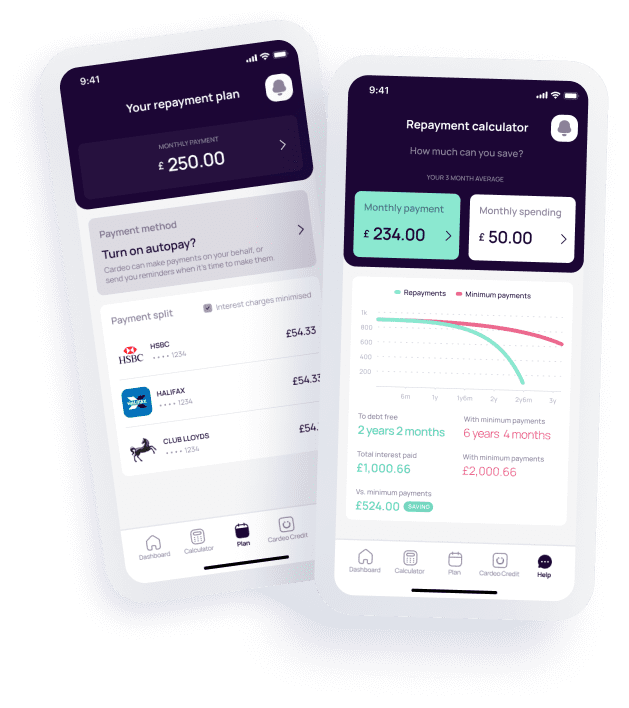
Repayment Calculator
We also built a repayment calculator so that users could make more informed decisions. The repayment calculator enables users to calculate how much they can save. Once they have entered their finance details, we present repayments and minimum payments in graph form. The app then works out the best way to split the monthly payment across users’ cards to reduce interest. This gives users the ability to create their own repayment plan and reduce fees.
Cardeo Credit
We’ve also used blockchain technology so that users can take a loan through Cardeo and set a credit limit. The credit dashboard displays balance, interest rate, total limit, statements, and transactions, so they can manage the whole process via the app. Users can increase their credit limit, as well as split transfers.